
Public relations (PR) helps people discover a brand through news stories, expert commentary, events, and relationships. Measuring that work means following several kinds of evidence: the coverage people could encounter, what the intended audience remembers, and the actions that follow.
A practical PR report gives those observations separate names and connects them to a stated goal. Share of voice, the proportion of counted coverage that mentions your brand, can describe your presence in a defined media landscape. Audience research can test recognition and recall. Enquiries, registrations, and other relevant actions add evidence about what people do next.
This guide shows how to build that report, keep competitor comparisons fair, and choose a useful first measurement project. The examples are hypothetical. The measurement guidance and primary sources were checked on October 14, 2026.
Start with an audience and a change
Write down who you want to reach, what you want them to learn, and why that learning helps them. Then decide when you will check progress.
For a local repair business, the goal might be that homeowners recognize the company and know it offers evening appointments. A software company might want operations managers to associate its product with a specific reporting problem. A community organization might want residents to know where a new service operates and how to use it.
Choose one audience change you can actually observe. A useful planning sentence is: “By the end of this campaign, more people in [audience] will know [specific fact], measured through [method].” Establish a baseline before setting a numerical target. Check whether the budget and sample can detect a change of that size.
AMEC’s Barcelona Principles 4.0, published in June 2025, call for measurable objectives, understanding stakeholder audiences, and transparent evaluation that includes both quantitative and qualitative analysis. They also reject advertising value equivalents, which assign coverage a supposed value based on advertising prices. That price does not establish what a reader learned or what the coverage contributed.
Give each kind of evidence a job
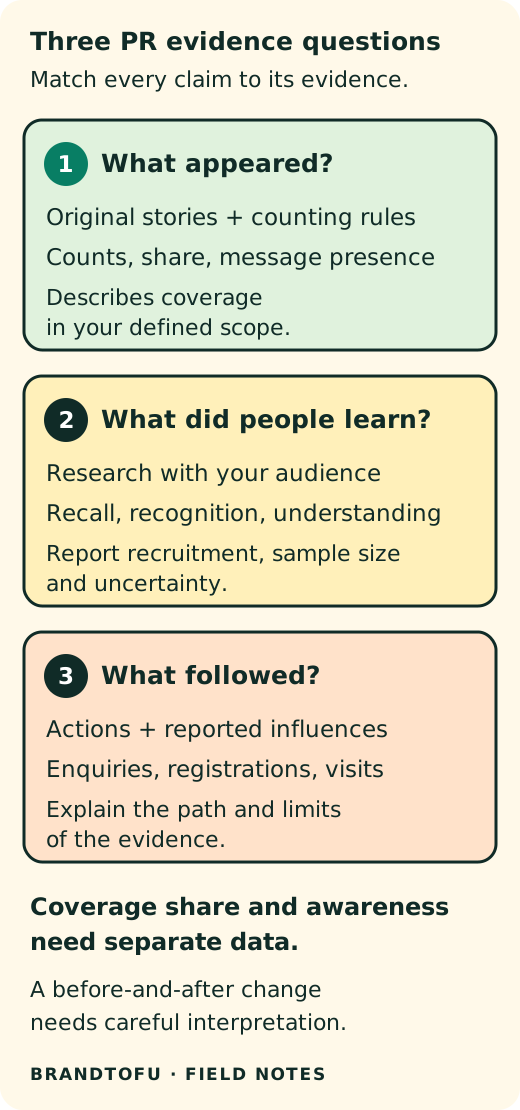
Keep three questions visible throughout the project:
- What appeared? Record relevant stories, interviews, mentions, event participation, and the messages those items contained.
- What did people take away? Investigate recognition, recall, understanding, and perceptions in the intended audience.
- What followed? Look for relevant enquiries, event registrations, subscriptions, partnerships, or other actions connected to the objective.
AMEC’s Integrated Evaluation Framework helps teams plan this chain. It distinguishes communication outputs, audience responses, outcomes, and organizational impact. For this guide, the three questions provide a compact way to organize a working report. They are our practical grouping, not a replacement for the full framework.
A published interview belongs in the coverage record. A survey respondent remembering its subject supplies audience evidence. A person saying that interview prompted a workshop registration supplies a reported connection to an action. Each observation answers a different question. Keep its source and limits attached.
Make the coverage record checkable
Create a simple coverage log with one row per counting unit. Your unit could be one article, one broadcast segment, or one podcast episode. Choose it before comparing periods.
For each row, save the source URL or reference, publication date, outlet, channel, brand mentioned, topic, and reason for inclusion. Add fields for the message you wanted communicated and the tone toward your brand. Save a short supporting excerpt or note where your access and permissions allow it. A reviewer should be able to open the original and understand your decision.
Write a short rule sheet:
- Scope: topics, languages, countries, channels, and date range.
- Brands: your brand, competitors, spelling variants, and names that need disambiguation.
- Inclusions: what counts as a relevant editorial mention.
- Exclusions: owned posts, paid placements, unrelated names, and other categories outside the stated scope.
- Duplicates: how you treat syndication and repeated versions of the same story.
- Review: who checks uncertain classifications and how changes are recorded.
For example, a regional food brand could count editorial stories about ready-to-eat lunches in a fixed list of local outlets. Its own Instagram posts would sit in a separate channel report. A national technology company could use a trade-publication set with a different scope. Both can build useful records; their percentages describe their chosen media sets.
If syndicated copies are counted separately, say so. If you collapse them into one original story, apply that rule to every brand and period. Neither approach identifies unique people reached. A publication’s monthly audience also cannot tell you exactly how many people read one specific article. Ask a supplier what its audience estimate represents before labeling it “readers.”
Manually review a sample of ordinary records and inspect edge cases such as ambiguous names, mixed sentiment, and duplicates. Track corrections by type so you can improve the search or classifier. Choose the review effort to fit the volume and consequence of errors. AMEC’s Principle 4 guidance explicitly calls for human checks when AI or natural-language processing supports qualitative analysis.
Compare share of voice with a stable denominator
For an article-based measure, calculate:
Your brand’s relevant article mentions ÷ relevant article mentions for all brands in the chosen comparison set × 100.
If an article mentions two brands, it can contribute one article-brand mention to each. State that choice. The denominator is then a total of article-brand mentions, not a count of unique articles. When there are no qualifying mentions, report the measure as unavailable.
A hypothetical example shows why counts belong next to the percentage. In one month, your brand has 20 mentions and three competitors together have 80. Your share is 20%. In the next month, you still have 20, while competitors together have 30. Your share is now 40%. Your counted coverage stayed flat; the comparison set became smaller.
Report your count, competitor counts, total count, and percentage together. Keep the same scope, counting unit, duplicate policy, and inclusion rules across brands. A change in search terms or media access can create an apparent trend. Record it and, where possible, recalculate the earlier period with the revised method.
The source discussion that prompted this guide raised a common problem: leadership wanted a competitive number, while the team doubted its monitoring results. The asker also explained that leadership wanted message comparisons with competitors. A consistent coverage method and common message test can support that comparison. Audience awareness still needs a separate measurement.
Check what the stories communicate
Define a message in words a reviewer can apply. For a repair company, it might be: “The company offers appointments after normal working hours.” Count a story as carrying that message when it communicates the idea accurately, even if it uses different phrasing.
Report message presence as a fraction: qualifying stories carrying the message divided by qualifying stories mentioning the brand. Show the counts as well. If the hypothetical company appears in 12 relevant stories and seven explain evening appointments, report “7 of 12 stories carried the evening-appointment message.” Those are coverage observations; the report has not yet tested reader memory.
For competitor analysis, add a category-wide question that can apply to everyone: “Does the story clearly explain the service’s availability?” You can compare that across brands, then show each brand’s particular association separately. Comparing your highly specific campaign slogan with another company’s broad category description would produce an uneven test.
Keep negative coverage visible. If you calculate a separate positive-or-neutral share, name it and publish the filtering rule beside the overall counts. Review tone toward the brand specifically: an article about a difficult industry problem can still describe a brand’s response favorably. A single blended quality score can hide those distinctions. Separate fields make disagreements easier to inspect.
Measure awareness with people in the audience
To learn whether awareness changed, design audience research around the people you intended to reach. A customer-only survey describes customers. An Instagram poll describes the people who saw and answered that poll. Label those samples accurately.
A short questionnaire can ask:
- Unaided recall: “Which home repair companies come to mind?” Let people answer in their own words.
- Aided recognition: “Which of these companies had you heard of before today?” Present a suitable brand list after the recall question, with a “none” option.
- Message understanding: “What services do you associate with [brand]?” Use an open response or carefully tested options suited to the objective.
Ask recall before displaying brand names so the recognition list does not supply the earlier answer. Pilot the wording with a few people from the intended audience. Keep question wording, order, survey mode, and recruitment approach consistent across measurement waves, and record any changes. Pew Research Center’s questionnaire guidance explains how wording, answer options, and earlier questions can affect responses and trend comparisons.
Report the number of respondents and how they were recruited. Explain uncertainty with help from a researcher when you need a decision based on a small change. For illustration, 50 people recognizing a brand among 200 respondents is 25%. A later sample giving 60 of 200 is 30%, a five-percentage-point observed difference. Sampling uncertainty, recruitment changes, and other influences still need evaluation before calling it a reliable increase or a PR effect.
When a suitable quantitative study is beyond the current budget, interviews can explore where people encounter the category and how they describe the brand. Use them to improve your message and future questionnaire. Label them as qualitative evidence; a few interviews cannot establish an audience-wide awareness percentage.
Connect actions carefully
Track relevant referral visits when you have access to reliable analytics. Add a voluntary, open “Where did you first hear about us?” question at an appropriate enquiry or registration step. Keep answers in the person’s words, allow uncertainty, and summarize only the information needed for the measurement.
These observations can reveal useful paths. A workshop registrant who names a local radio interview gives you a reported influence. A referral visit from a trade article shows a recorded visit through that route. Some readers will return another way, and some people will misremember their first encounter. Explain those gaps.
A before-and-after rise may coincide with PR, advertising, product changes, seasonal demand, or a competitor event. Record those events on the same timeline. If your decision requires estimating the additional change caused by PR, ask a measurement specialist to design a credible comparison or experiment in advance. Simply comparing people who remember coverage with people who do not remember it can mix existing interest with campaign influence.
Choose a report that fits the situation
For a small local campaign, begin with a checkable coverage log, message review, voluntary enquiry-source question, and a feasible audience-research plan. The first report can honestly say awareness has not yet been measured.
For an ongoing competitive PR program, retain a stable media set, show coverage counts and share together, use common category message tests, and commission repeated audience research when feasible. Annotate method changes and major market events.
For a launch or one-off event, record the baseline before coverage begins, choose the relevant registration or enquiry action, and define the follow-up window in advance. A short event campaign and a long reputation program need different timelines.
For a negative news period, show the tone, issues, accuracy of information, and audience concerns alongside volume. A larger coverage share can describe a difficult episode. Use listening and research to decide what needs explaining or repairing.
Build the first report this week
Agree on one audience, one intended learning change, and one reporting decision. Write the coverage rules. Review a small set of original stories together so the team can resolve classification disagreements. Establish the baseline and decide what audience research is feasible.
Your report can then use five plain lines:
- Objective: the audience change you are trying to support.
- Coverage: counts, scope, share, and message presence.
- Audience evidence: recall, recognition, understanding, or clearly labeled qualitative observations.
- Relevant actions: recorded visits and voluntarily reported influences, with limits.
- Next step: one change or measurement test, its owner, and the next review date.
Keep the rule sheet and underlying records attached. The next reporting cycle should be easy for another person to reproduce.
Plan the measurement before the campaignAMEC’s planning guide connects the intended audience change to objectives and evidence.↗ Design a consistent awareness questionnairePew explains wording, response options, pretesting, and question-order effects.↗