
A social campaign can help people discover a shop, understand what it offers, and plan a visit. Measuring that contribution starts with an agreement about what counts as a visit and how the business will record it.
For a local retailer, a restaurant, or an appointment business, use a shared business target alongside channel measures. Count actual visits separately from directions requests, offer redemptions, and bookings. Compare changes with a credible baseline. Describe the strength of the evidence when reporting the result.
Agree on the visit you want to increase
“Footfall” means people entering a physical location. The term can conceal several different goals. A bookshop might want more first-time visitors. A café might want more customers during quiet weekday afternoons. A salon might want attended first appointments. Each goal calls for a different count.
Write a measurement agreement before making the content. Include the location, audience, hours, observation period, counting method, budget, and person responsible for collecting the data. Define how you will handle repeat entries, staff, delivery drivers, cancellations, and missing records.
For example: “Increase first-time customers attending a trial appointment at the north branch during the six-week campaign. Reception will record attendance and an optional discovery-source answer. The owner will review the count each week with the social team.” Six weeks is an example planning period, not a guarantee that every business will collect enough evidence in that time.
This question came up in a public discussion about a client's expectations for a social media team. The underlying problem applies across local businesses: a team needs an agreed way to connect its work with outcomes that several people influence.
A social team can commit to publishing, checking location information, running an agreed test, and reporting evidence. A visit-growth target can be a shared outcome with the business owner. A promise of a fixed number of additional visits needs a measurement method and assumptions that both sides accept.
Keep four kinds of evidence separate
An impression records exposure under a platform's counting rules. A direction request records an action that may precede a visit. A door count records entry. A comparison test tries to estimate how many visits the campaign added. These measures answer different questions.
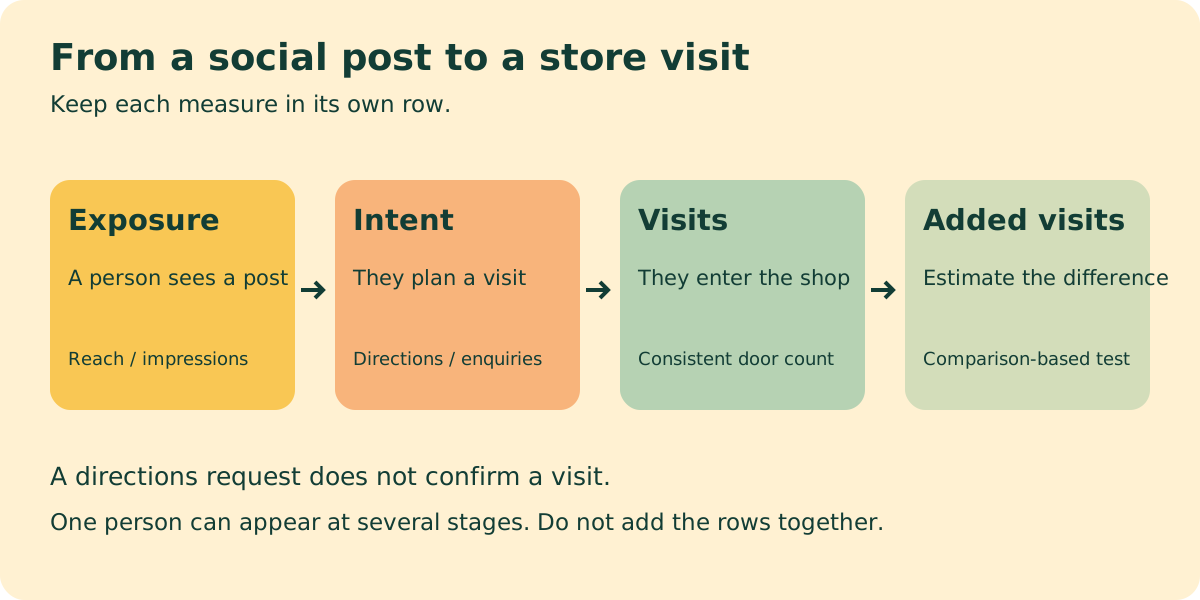
Start a report with the business count, then use channel signals to explain what may have contributed:
- Exposure: people reached, impressions, or video viewing under the platform's definitions.
- Intent: requests for directions, menu views, appointment enquiries, or visits to a location page.
- Recorded outcomes: counted store entries, attended appointments, or completed purchases.
- Estimated additional outcomes: the difference between what happened and a defensible estimate of what would have happened under a comparison condition.
Keep the rows distinct. One customer may see a post, request directions, redeem a code, and buy something. Adding those counts together would count several steps in one journey as several customers.
Google's Business Profile performance definitions illustrate this distinction. Directions measures requests for directions. Calls measures clicks on the call button. Profile performance can include activity from organic results and Google Ads. A rise in those totals does not, by itself, identify social media's contribution or establish a completed store visit. Check which metrics are available for your verified profile.
Build a visit log the staff can maintain
Choose one primary count and collect it consistently before and during the campaign. Use the same hours and counting rule. A door sensor may count entries, while a till counts transactions. One shopping party can produce several entries and one purchase. Label the unit in the report.
A small shop can begin with a daily log containing the date, opening hours, counted entries, transactions, campaign activity, and notes. Record closures, weather disruptions, stock shortages, special events, and price changes. Those notes help explain a spike or decline later.
If the business asks customers how they found it, keep the question neutral: “What first brought the shop to your attention?” Allow “don't remember” and an optional answer. A second question about what prompted today's visit can reveal a different influence. Someone may first notice a creator's video and visit later after a friend's recommendation.
Store the response categories needed for the analysis. A daily aggregate such as “six mentioned Instagram” is enough for many small reporting tasks. This example does not require names, handles, or a record of each person's movements.
A campaign code supplies another signal. Use a code tied to a specific offer, location, and period, and record redemption at the till. Explain the offer clearly in the post. Codes can be shared, forgotten, or used by existing customers, so a redemption count describes use of the offer. It does not automatically count new customers or additional visits caused by the campaign.
For a salon, track bookings, cancellations, and attended appointments separately. For a restaurant, distinguish covers (people served), table bookings, walk-ins, and transactions. For an event, distinguish registrations, checked-in attendees, and later store visits. Choose the unit before comparing periods.
Work through a comparison in a spreadsheet
The following numbers are fictional teaching data. They are not BrandTofu results or a customer case study.
Imagine two broadly similar shops. One receives a local social campaign. The other continues its usual activity. Each shop records visits over comparable before and campaign periods with the same counting method.
The test shop goes from 100 visits to 130. The comparison shop goes from 80 to 88. The first shop grew by 30%; the comparison grew by 10%.
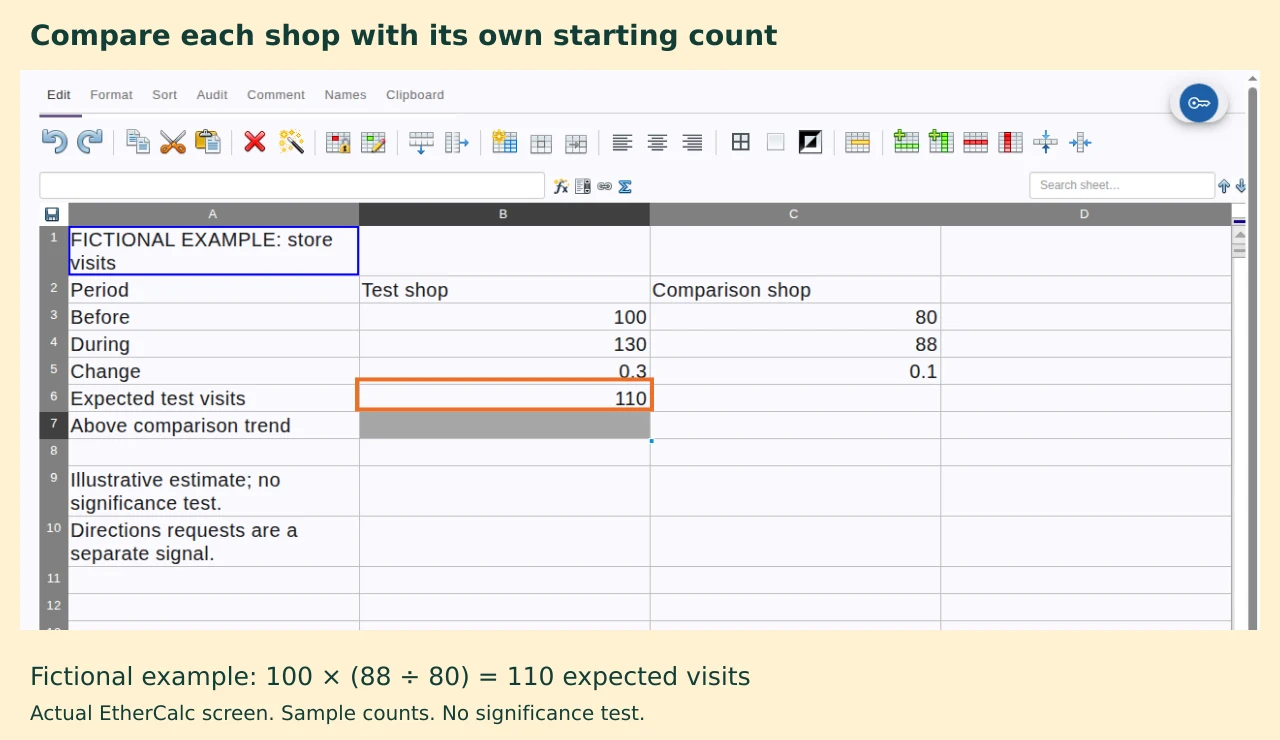
In a spreadsheet, put the test shop's before and during counts in B3 and B4. Put the comparison shop's counts in C3 and C4. The percentage-change formulas are =B4/B3-1 and =C4/C3-1. Format them as percentages if your spreadsheet initially displays 0.3 and 0.1.
If the test shop had followed the comparison shop's 10% growth, its expected count would be 110. Calculate that in B6 with =B3*(C4/C3). Then calculate the difference in B7 with =B4-B6: 130 minus 110 equals 20 visits above the comparison trend.
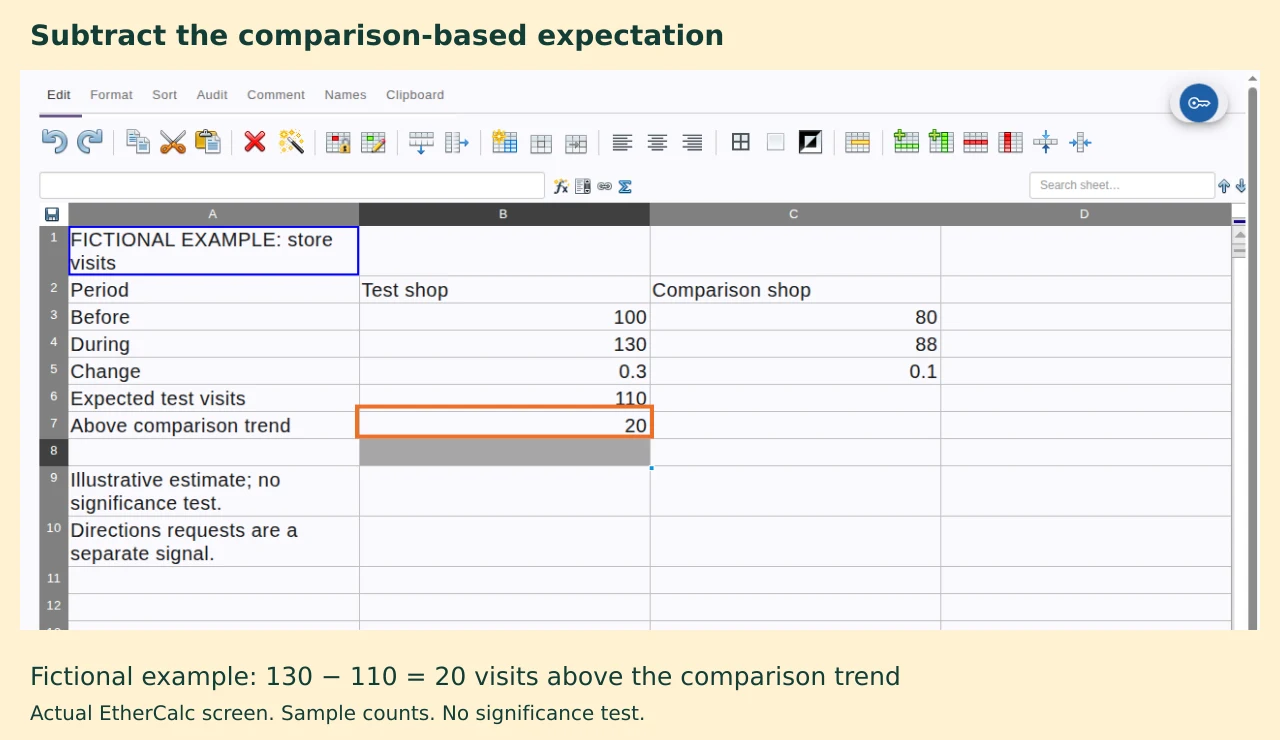
Report the interpretation alongside the arithmetic: “The campaign shop recorded 20 visits above the comparison trend in this illustrative calculation.” Calling all 30 additional visits a campaign result would ignore the growth seen at the comparison shop.
The calculation assumes that the comparison shop's growth is a reasonable estimate for the test shop. That assumption can fail. A nearby road closure, different stock, a local event, or a promotion at one shop can change the result. The small example has no uncertainty interval or statistical significance test. It demonstrates the arithmetic only.
Before using this approach for a budget decision, examine several earlier periods for similar movement, choose comparison locations before seeing the result, and check for overlapping audiences. A campaign reaching customers of both shops can contaminate the comparison. With several suitable locations, random assignment to campaign and comparison groups can strengthen a test. Ask an analyst to size the test around the visit variation and the change you need to detect.
Choose a test that fits the business
A single-location business can compare matching weekdays and opening hours over several periods, recording changes in offers, staffing, weather, and local activity. This can reveal a pattern and support the next decision. A before-and-after change alone cannot isolate the campaign from everything else that changed at the same time.
If the shop has enough observations, an analyst may help plan alternating campaign periods. Allow for delayed visits: a person can see a post on Tuesday and arrive on Saturday. Organic posts can remain visible after a test period ends. Those effects make short on/off comparisons harder to interpret.
A business with several similar locations can consider a location comparison. Decide which stores receive the campaign, keep the offer and measurement consistent, and write the analysis plan before launch. Paid location targeting may provide more control over exposure than a public organic post. Check how precisely the platform can target the areas involved and how much audience overlap remains.
Where an advertising platform offers an eligible lift study, review what it randomizes, which outcome it measures, and what data it needs. “Lift” means an estimated additional effect of the treatment compared with a comparison condition. Availability and eligibility vary. Do not build a small-business reporting plan around a feature that the account cannot access.
Google Ads provides a separate example of platform measurement. Its store visit documentation describes modeled visit counts and eligibility requirements involving location assets, geography, data volume, and privacy thresholds. That report measures Google ad interactions under Google's method. It is not a universal counter for visits following organic social activity.
Google also explains that recent store-visit totals can change as more data arrives. Label modeled reports, the reporting window, and the date you extracted the figures. Keep them separate from your shop's own count.
Turn the report into a decision
Give the owner the count, the comparison, the supporting signals, and the next action in connected language. For the fictional example: “Visits rose from 100 to 130. The comparison shop grew 10%, giving an illustrative expectation of 110 visits and a difference of 20. We have not tested whether that difference exceeds normal variation. We will extend the observation period and check whether the pattern repeats before increasing the budget.”
If reach rises and intent stays flat, inspect the audience, message, and next step in the content. Show what the shop offers, who it serves, its location, and when someone can visit. If enquiries rise and attendance stays flat, inspect opening hours, appointment availability, directions, stock, and the response process with the owner.
If visits rise while purchases stay flat, examine what visitors find after arriving. Keep the measurement unit stable as the team investigates. A reported visit increase should not silently turn into a sales claim.
For the next campaign, write down the visit definition, data owner, comparison plan, observation period, and decision rule before the first post goes live. That agreement gives the social team and shop owner a common basis for reviewing the result.