
Shop traffic can tell you where people arrived and what they looked at. A period with few orders calls for a closer look at those visits, the promise that brought them, and the buying path. Start by matching the reporting period and metric definitions. Then choose a specific problem to investigate before changing your marketing.
A person watching a making-of video, a shopper comparing gifts, and a customer returning to buy can all reach the same product page. Their reasons for visiting differ. A single total hides that mix.
This article began with a new handmade-shop owner's public question: the owner was promoting the shop on social media and reported visits with no orders for the week. The same problem appears in clothing, homeware, digital downloads, and specialist supplies. The process below is BrandTofu's editorial framework. All example shop figures and proposed tests are fictional. Platform documentation and the demonstrated charting tool were checked on November 3, 2026.
Match the numbers to the same period
Choose a completed reporting period and save its dates, time zone, and last refresh time. Record visits, product views, orders, and the traffic-source breakdown from that same period. A shop's lifetime sales count cannot explain its conversion rate for the past week.
On Etsy, open Shop Manager, then Stats, and select the reporting period. Its Stats instructions explain the source breakdown and refresh schedule. Visits refresh several times a day, and further bot filtering can reduce the count. Save a settled period before comparing it with another.
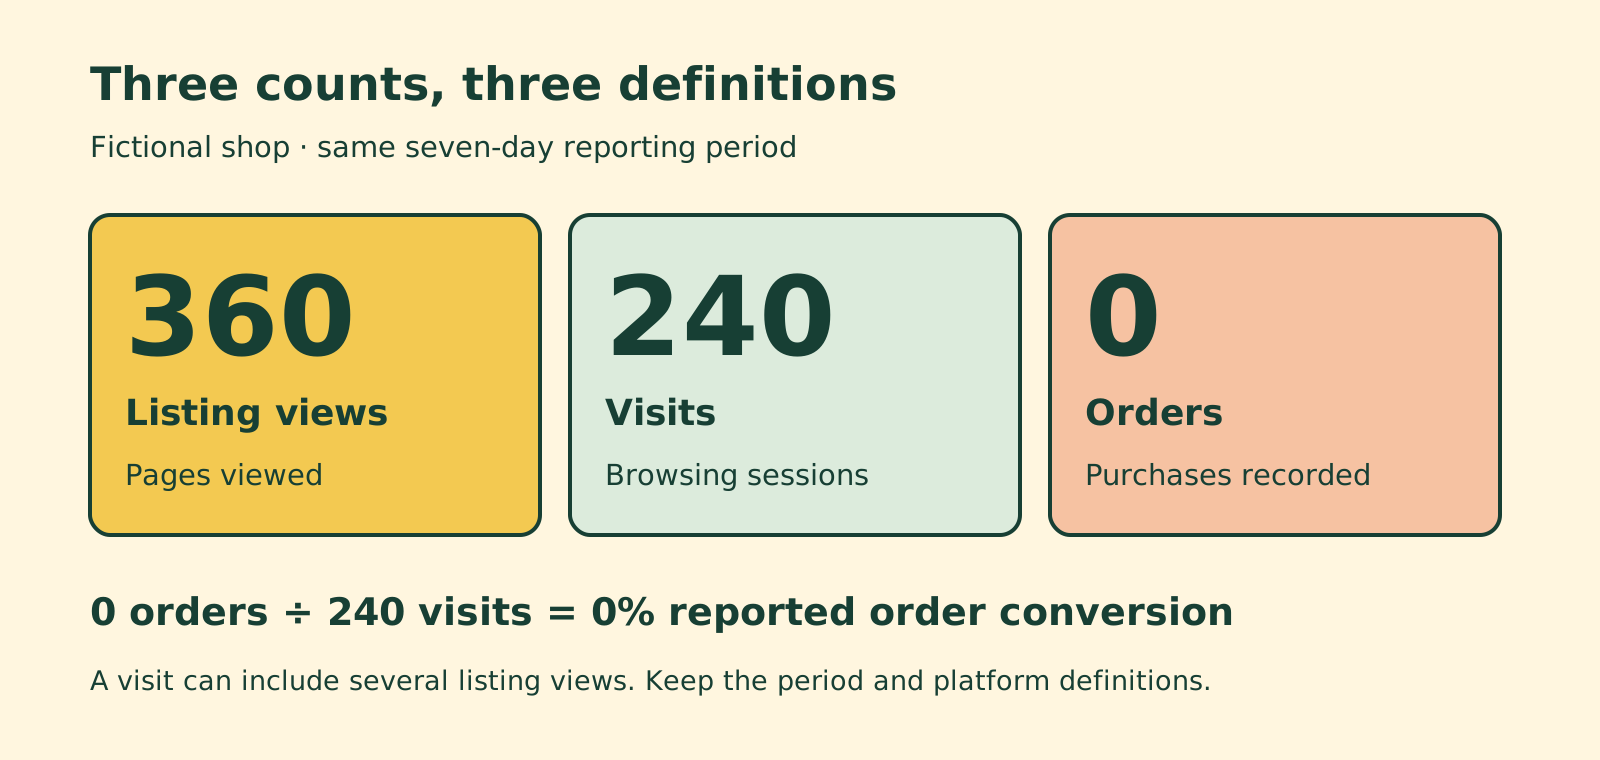
Keep the source platform's labels beside your figures. Etsy's Stats glossary defines a visit as a browsing session; that session can contain several listing views. Orders count purchases, which can contain several items. Its conversion rate relates visits to orders. A shop with 360 listing views, 240 visits, and no orders has a reported order conversion rate of 0% for that period. The 360 views describe a different activity.
For a shop on its own website, check the analytics system's definitions. Shopify's behavior reports distinguish sessions, sessions with cart additions, sessions reaching checkout, and sessions completing checkout. Those stages can help locate a problem when your store records them. An Etsy shop-level report does not give you an identical checkout funnel.
When comparing reports, check for measurement changes too. Shopify documents a September 2026 session-measurement update that can affect session-based metrics. A reporting change can move a rate even when customer behavior has stayed the same.
Separate traffic volume from audience fit
A traffic source tells you something about the route into the shop. It leaves questions about the visitor's purpose open.
For each source, write down the audience you intended to reach, the post or campaign they could have seen, and the destination linked from it. Mark uncertain information as unknown. A direct-or-other category can contain several routes, so avoid treating every visit in it as a person who remembered your brand.
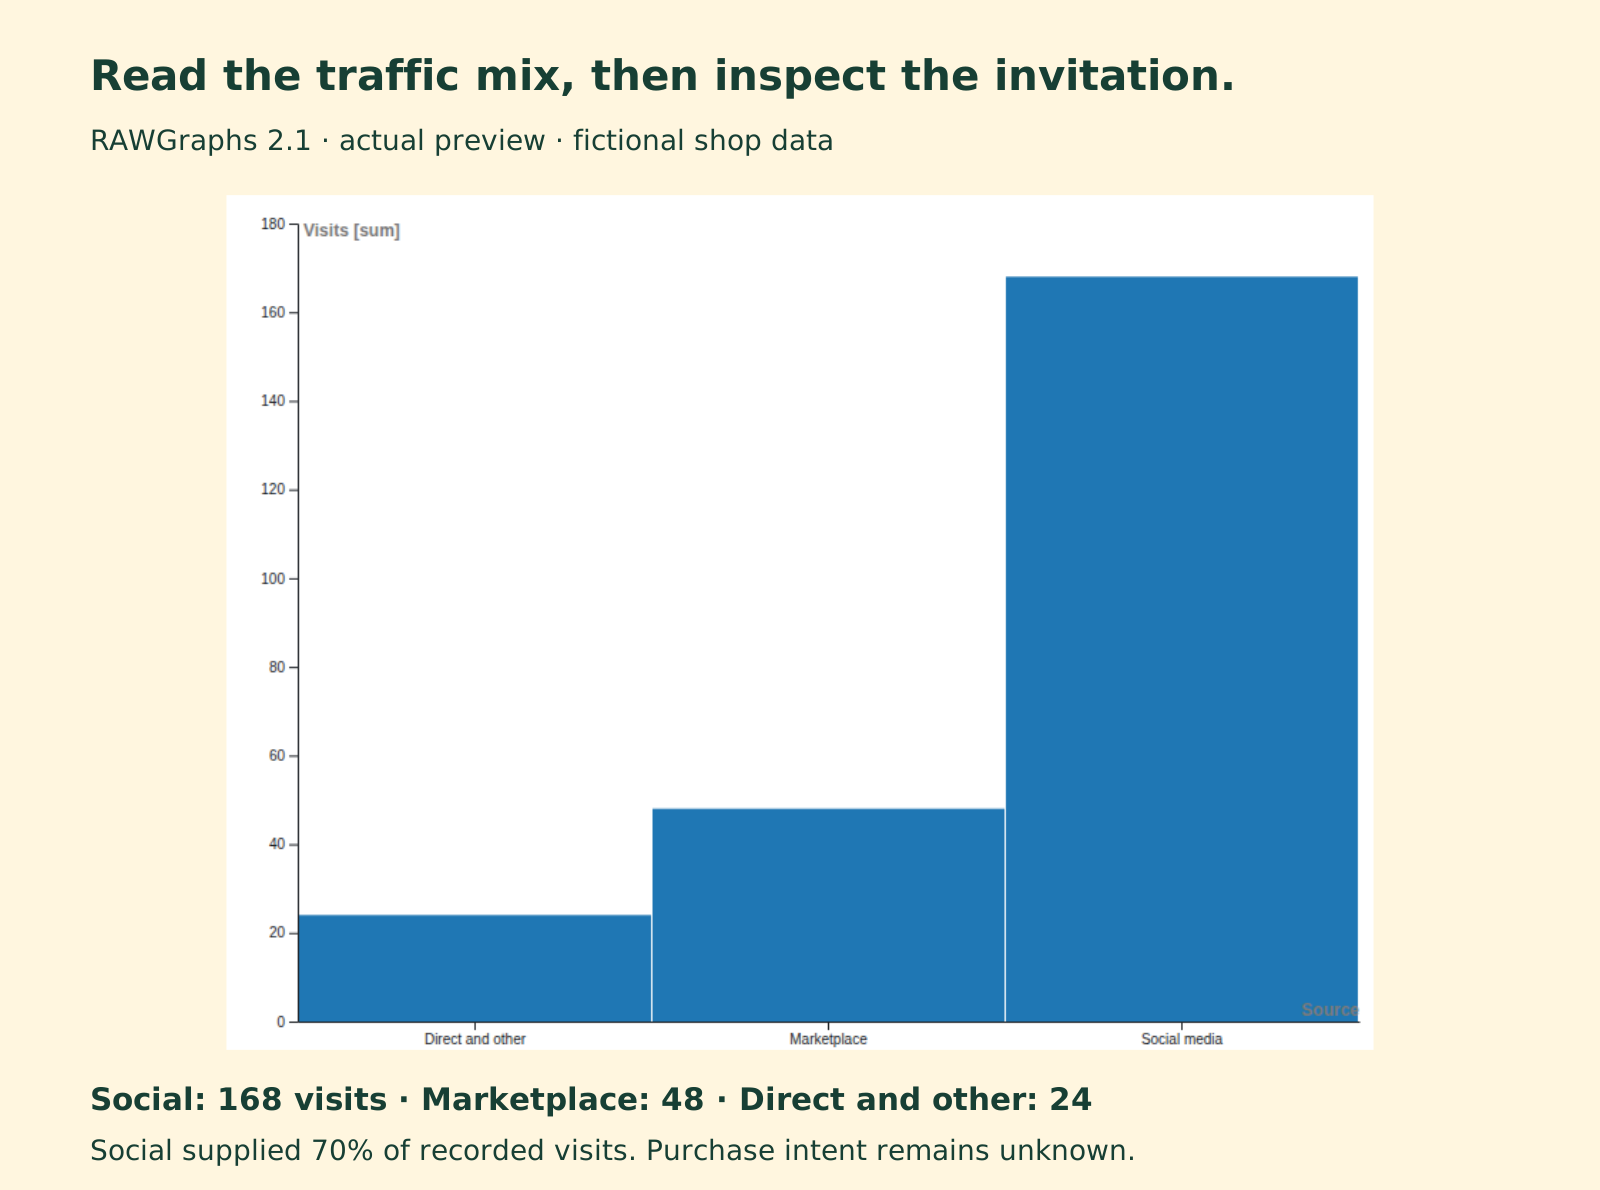
Consider a fictional ceramics shop's seven-day record: 168 visits from social media, 48 from a marketplace, and 24 from direct and other sources. That is 240 visits in total. Social accounts for 70% of this recorded traffic. The figures give the owner a place to begin checking the route into the shop. They do not establish which visitors were ready to buy or which source would produce the next order.
Our example groups routes for teaching. In your own record, retain the categories supplied by your platform and explain any grouping. Etsy's source labels have particular scopes. Its desktop search category excludes app search, for example. Read those scopes before comparing sources or combining advertising reports with shop Stats.
If you have source-level purchase data, record its attribution method: the rule used to give a source credit for a purchase. If you only have shop-wide orders, leave source-level orders unknown. Dividing all shop orders by each channel's visits would give every channel credit for the same purchases.
Make a traffic-source chart you can inspect
We used the public RAWGraphs editor to turn the fictional source counts into a bar chart. The demonstrated paste, mapping, and preview steps required no signup or payment. Its project repository documents the open-source visualization tool. This walkthrough charts example counts; it does not connect to a shop or import customer records.
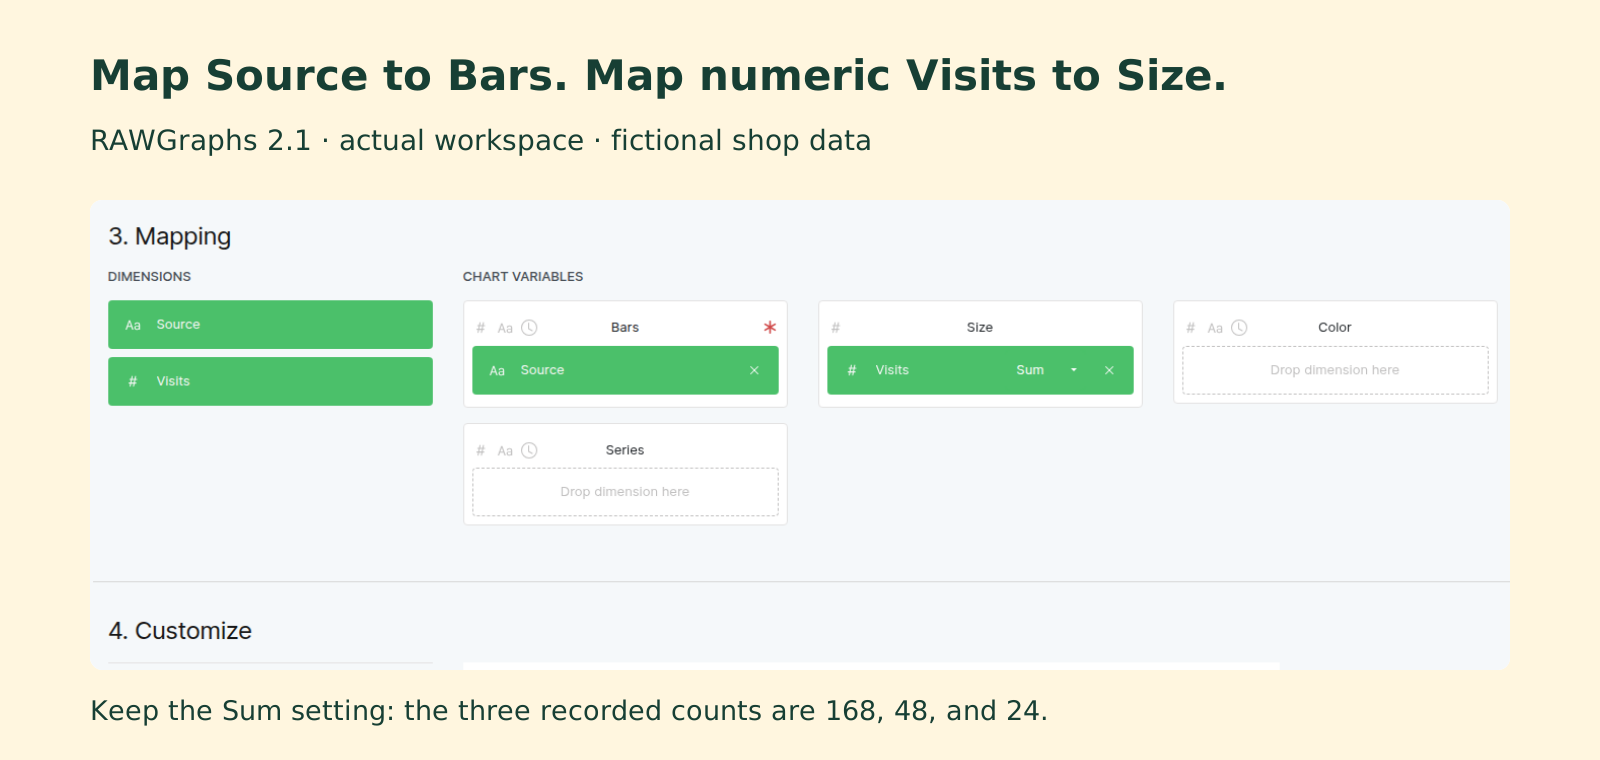
Paste a structured list containing a source name and a numeric visit count for each row. Select the list to load it, choose Bar chart, drag Source to Bars, and drag Visits to Size. Check that Visits has a number type and that Size uses Sum. The result should preserve the original counts: 168, 48, and 24. For a small record, a written list can serve the same purpose.
The finished chart makes the traffic mix visible. In this example, it directs attention toward the social invitation because social supplied most recorded visits. It leaves the reason for no orders unresolved. The next step is to inspect what those visitors expected to find.
Trace the promise from post to product
Open the exact link a prospective shopper would follow. Compare the post with the page it reaches. Can someone identify the product shown, see whether it fits their needs, understand the price and delivery conditions, and find the next step?
A pottery-process video may draw people interested in making ceramics. If the business wants to reach gift buyers, a proposed post could show a finished mug in use, its size, available options, and the route to that item. That is a hypothesis about audience and message fit. Check the response before expanding it.
A digital-pattern seller faces another problem: visitors may mistake a download for a finished object. The post, first product image, and description should state what the buyer receives. A custom clothing seller may need to explain sizing, measurement requirements, production time, and how to request an option. These are different obstacles, even if both shops report traffic with few orders.
Read customer questions alongside the numbers. Repeated questions about whether an item is ready to ship suggest a missing explanation. A popular tutorial attracting other makers may be serving an educational audience. Neither observation alone proves why somebody left. It gives you a question you can investigate.
Invite someone who fits the intended audience to walk through the page and explain what they think is offered. Ask them to find the size, delivery information, or personalization step. Observe where they hesitate. Keep their observations separate from your explanation of the problem, and get permission before retaining or sharing their material.
Check the buying path before paying for more visits
Inspect the public product page on a phone. Check the selected variant, stock status, delivery area, shipping cost, estimated arrival, and the information required for a custom order. Follow the permitted buying steps in your own store's test setup where available. Record what you actually checked.
When your analytics records cart and checkout stages, use them to focus the inspection. Few cart additions could lead you to investigate product fit, information, or the offer. Checkout starts with few completions could lead you to investigate delivery costs, payment behavior, or technical errors. Each pattern can have several explanations. Verify the suspected issue in the actual store.
Etsy's guidance on sales counts also explains why public sales, Stats orders, and completed-order counts can differ. Use the report that matches your question, including its treatment of canceled orders and refresh timing.
Repair a confirmed broken link or unavailable option as soon as you find it. Record the repair date so a later comparison has that context. Increasing promotion while the buying path has a known fault can bring more people to the same obstacle.
Choose a bounded change and review it
Write the suspected problem, the supporting observation, the change, and the evidence you will review. Include a time budget and, if relevant, a spending cap. Keep the scope small enough to understand what you changed.
For the fictional ceramics shop, a test record might say: “Our process posts link to the general shop. We will publish a finished-mug demonstration for gift shoppers and link to the matching available item. At the review, we will inspect the recorded source visits, the questions received, shop-wide orders, and the time spent making and answering the post.” Source-specific orders remain unknown unless the reporting system supplies them under a stated attribution rule.
A second shop might leave its promotion unchanged and clarify that a pattern is a download. A third might fix a mobile variant selector. Choose the change from the observed problem. Discounts, more listings, and a higher posting frequency are separate decisions; a week with no orders does not establish which of them would help.
Choose a review period that fits the shop's traffic and purchase process. There is no universal number of visits or days that guarantees a dependable result. Keep raw counts beside percentages, especially when few purchases would move the rate substantially. A later sale may coincide with your change, seasonality, a different audience mix, or another event.
At the review, record what happened, what remains uncertain, and the next decision. If visitors still misunderstand what they receive, revise the explanation and check it with intended shoppers. If the page works and the audience fit remains unclear, investigate the invitation and distribution. Keep that decision attached to the evidence so the next marketing change starts from what you observed.